Interpretability of ML models – application to domain categorization

When training machine learning models, we often want to not only obtain a model with high accuracy but also want to know how important individual features for the importance of the model are.

There are several reasons why we are interested in this. Let us say that we are building a regression ML model which predicts prices of office as function of various features, like location, area, etc. When we train the model and it turns out that a certain feature A most affects the price, this can give important information to real estate development companies – which features are most important for customer price expectations in a given area or class of offices.

Feature importance can thus allow us to better understand the underlying problem.

The second reason for determining the importance of features is as part of the feature engineering for machine learning models. Each feature that we include in our machine learning model increases both the memory footprint of the model as well as the inference latency (time that ML model needs to carry out the inference for instance).

To build an efficient and fast ML model we thus want to only use the features that are important for the ML model prediction.

Permutation importance method can help us better understand why ML model makes specific classification in context of domain categorization model.

Domain categorization concerns itself with assigning classes or categories to domains based on texts of their webpages. This is also known as website classification problem.

Interpretability of ML models

When dealing with interpretability of ML models, there are two groups of approaches. First approach is to use a ML model which is naturally interpretable. Examples for such naturally interpretable ML models are linear regression, logistic regression and decision trees. E.g. in linear regression, absolute value of coefficients for features provides information about their importance.

The second approach to ML interpretability is to use whatever ML model is appropriate for the problem considered, regardless of its natural interpretability and then leave the interpretability to special methods, designed just for this. These so-called model agnostic interpretation models are highly flexible as you do not have to worry about the specifics of each model you use and it also allows you to easily compare several models that one may consider for the ML problem.

A great article on model agnostic methods is the following one (one of its authors is btw C. Guestrin who was also one of the founders of the ML library Turi Create that I mentioned for the recommender project):

https://arxiv.org/abs/1606.05386

As we are using a very complex XGBoost ML model I will focus here on the model agnostic methods.

One of the possible methods in this class is to use the mean decrease in impurity (Gini importance) for this purpose. This method is implemented for RandomForestClassifier in scikit-learn for determination of feature importance.  But it has been known for a long time that this approach has several problems, especially when dealing with features with different order of magnitudes or different number of categories. This is an excellent article describing the problems:

https://link.springer.com/article/10.1186%2F1471-2105-8-25

A better approach than the above is the so-called permutation importance method, which is the one that I used.

 

Generating images with transfer learning

Generating images with transfer learning is really interesting.

I’ve been playing with a new technique that has taken deep learning by storm: neural style transfer. Initially created by Leon A. Gatys, Alexander S. Ecker, and Matthias Bethge in 2015, neural style transfer is an optimization technique used to take three images, a content image, a style reference image (such as an artwork by a famous painter), and the input image you want to style — and blend them together such that the input image is transformed to look like the content image, but “painted” in the style of the style image.

I have uploaded the generated images here: https://ello.co/datascientist1

Product categorization and product tagging machine learning solutions

When you enter a physical store, you have tables above aisles that denote the category of products that are being sold in particular section.

The online equivalent of this are the product paths that show the main category, subcategory, level 3 category, and so on. In earlier days of internet these categories were set manually but with Amazon now selling millions of products, the product categorization has been automated in the meantime, using the machine learning and AI models for this purpose. There are millions of niches available for products to sell.

All one needs for training a ML model is a good training data set in the form of product name -> categories and then one can train an appropriate text classification model.

Regarding possible categories, there are two main options. One is Google Product Taxonomy and the other is IAB classification, both have Tier 1, Tier 2 and lower Tiers of categories.

For ecommerce product categorization, the more appropriate is the Google product taxonomy categorization, whereas IAB is more general and has gone through several revisions.

An excellent Saas platform that offers product categorization is Productcategorization.com. You can try out their demo at this address:

https://www.productcategorization.com/demo_dashboard/

It gives the output in form of nice chart as well as json file that can also be exported.

Another important version of categorization involves tagging of products. This is a more modern version of trying to classify the products and has the added benefit that there is no general upper limit on number of tags that can be assigned to products of online ecommerce shop.

A solution offering product tagging is available at producttagging.com. You can try out demo of product tagging at:

https://www.producttagging.io/demo_dashboard/

I tried diamond earring and got these tags (with percentages denoting how relevant is the tag for the product name):

diamond
58 %
earrings
33 %
earring
22 %
diamond earrings
7 %
jewelry
6 %
white gold
6 %
diamonds
6 %
yellow gold
4 %
hoop
3 %
bridal

2 %

If you are interested in learning more details on theoretical background to product categorization, check out an article on this topic:

https://medium.com/product-categorization/product-categorization-introduction-d62bb92e8515

Interesting collection of slides on the topic of product categorization: https://slides.com/categorization

Product tagging and categorization have a bright future with number of online shops rapidly increasing.

Another text, more general text classification problem is website categorization.

Crypto social media analysis

Social media has played an important role in driving the narrative around cryptocurrency sector in recent years. Although initial paper of Satoshi Nakamoto was published on forum posts, see e.g. satoshi nakamoto posts, in the later years the hype about cryptocurrencies was nevertheless substantially driven on social media, especially twitter.

It is interesting that in recent times the social media became important also for the stock market sector, where subreddits like https://www.reddit.com/r/stocks/ have been important drivers of stocks like it happened with Gamestop earlier this year. Social media is increasingly democratizing the information of crowds, solving one of the earlier pain points of finance – namely how to inform people about the financial stocks. Though one would also strongly advise that the new investors pay a lot of attention to fundamental data about stocks.

But back to crypto social media analysis. How does one approach this?

First is to built a bot, which regularly analyses twitter, reddit, youtube and other social media websites. When analysing given text, one parses it to find mentions of cryptocurrency tickers and names, e.g. BTC and Bitcoin. Python library flashtext: https://github.com/vi3k6i5/flashtext

Here is an example of news title (from sentiment api), that have been tagged with respective cryptocurrencies:

Then, the text is classified in terms of sentiment. One way to build a classifier is for example by using Support Vector Machines for this purpose.

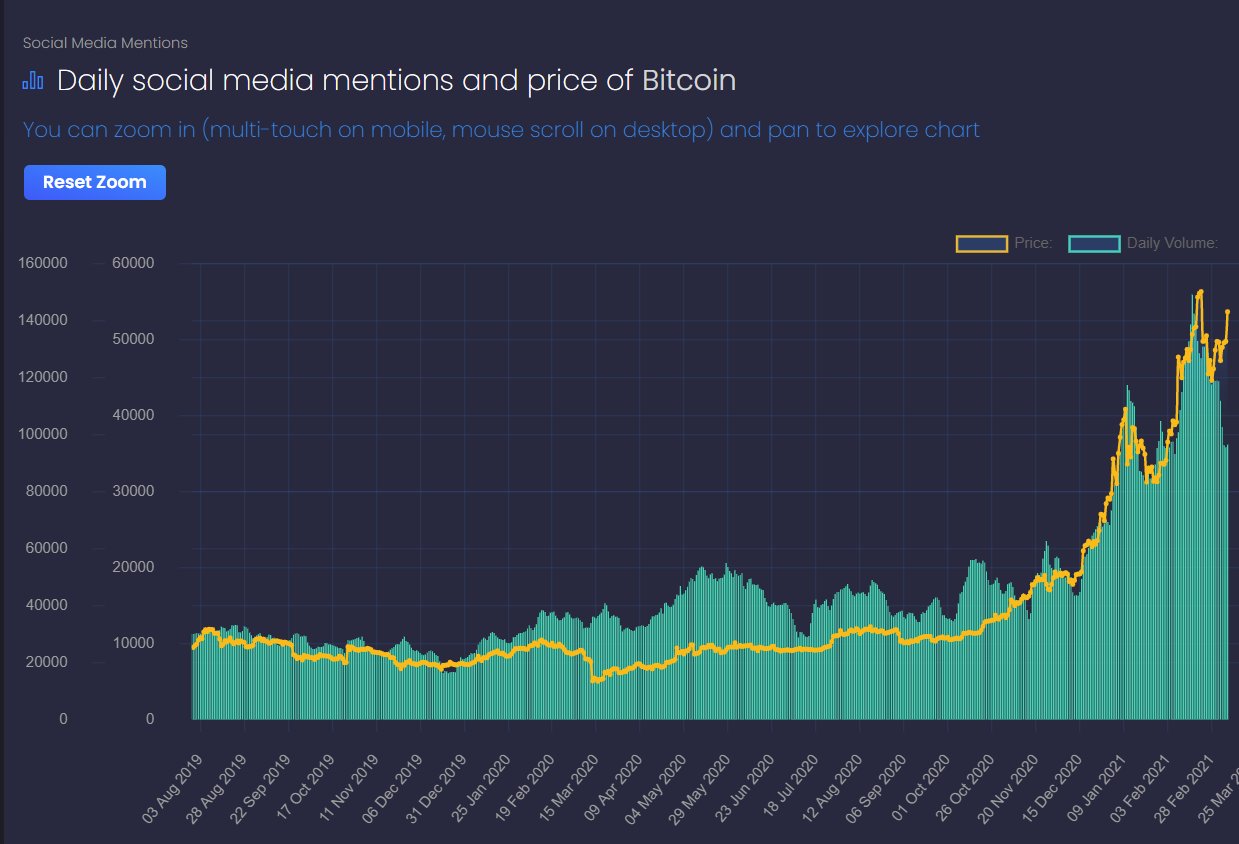
Both types of data gives us an effective way of crypto social media analysis – it allows us to display information both about the number of social media mentions of cryptocurrencies as well as about their sentiment.

The interesting thing is that the social media mentions often closely follow price, here is an example for Bitcoin:

In the last few days the relation was almost 1:1. It is thus useful to take crypto social media analysis as additional source of information into account when analysing the crypto market.

Data Visualization Consulting

There is an old saying that one picture is worth a thousand words and in the modern content marketing this is often true. The most viral posts that one encounters are often the ones where someone produces an interesting presentation of unique data set and its analysis.

Another topic that also gets a lot of interest are infographic.

Data Visualization Consulting has thus emerged in the recent years as an important way to generate interests for content and thereby via acquiring a lot of links also improved search engine rankings.

Our AI company for Data Visualization Services Consulting specializes in producing unique and great data visualization charts and images to help the clients in providing unique stories and angles on their content.

We also provide a platform for Keyword, Niches and Trends Research – UnicornSEO, which allows you to explore complete niches in an in-depth way.

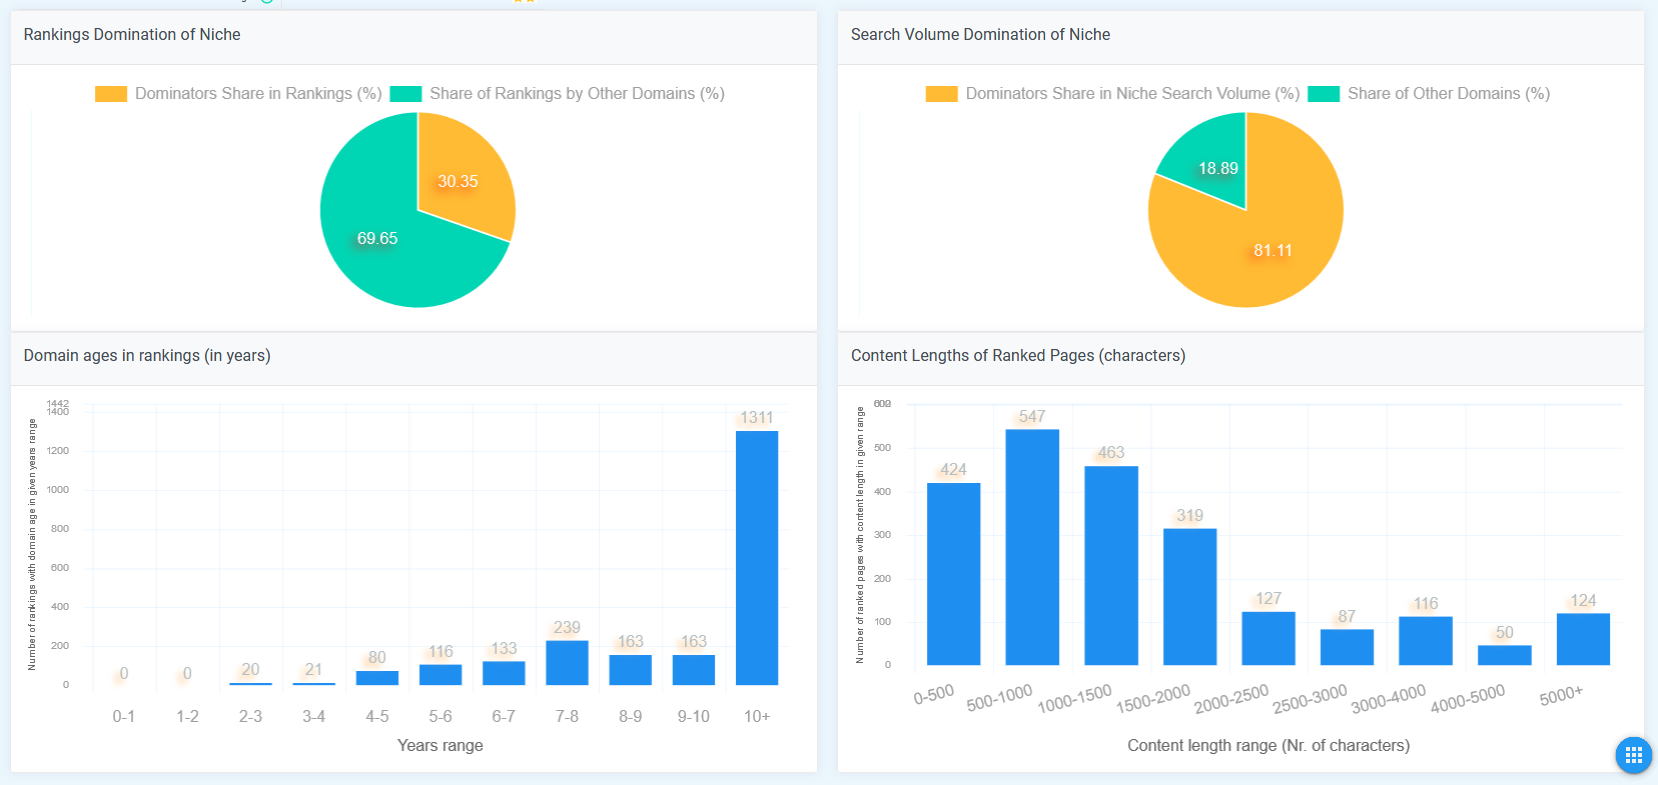
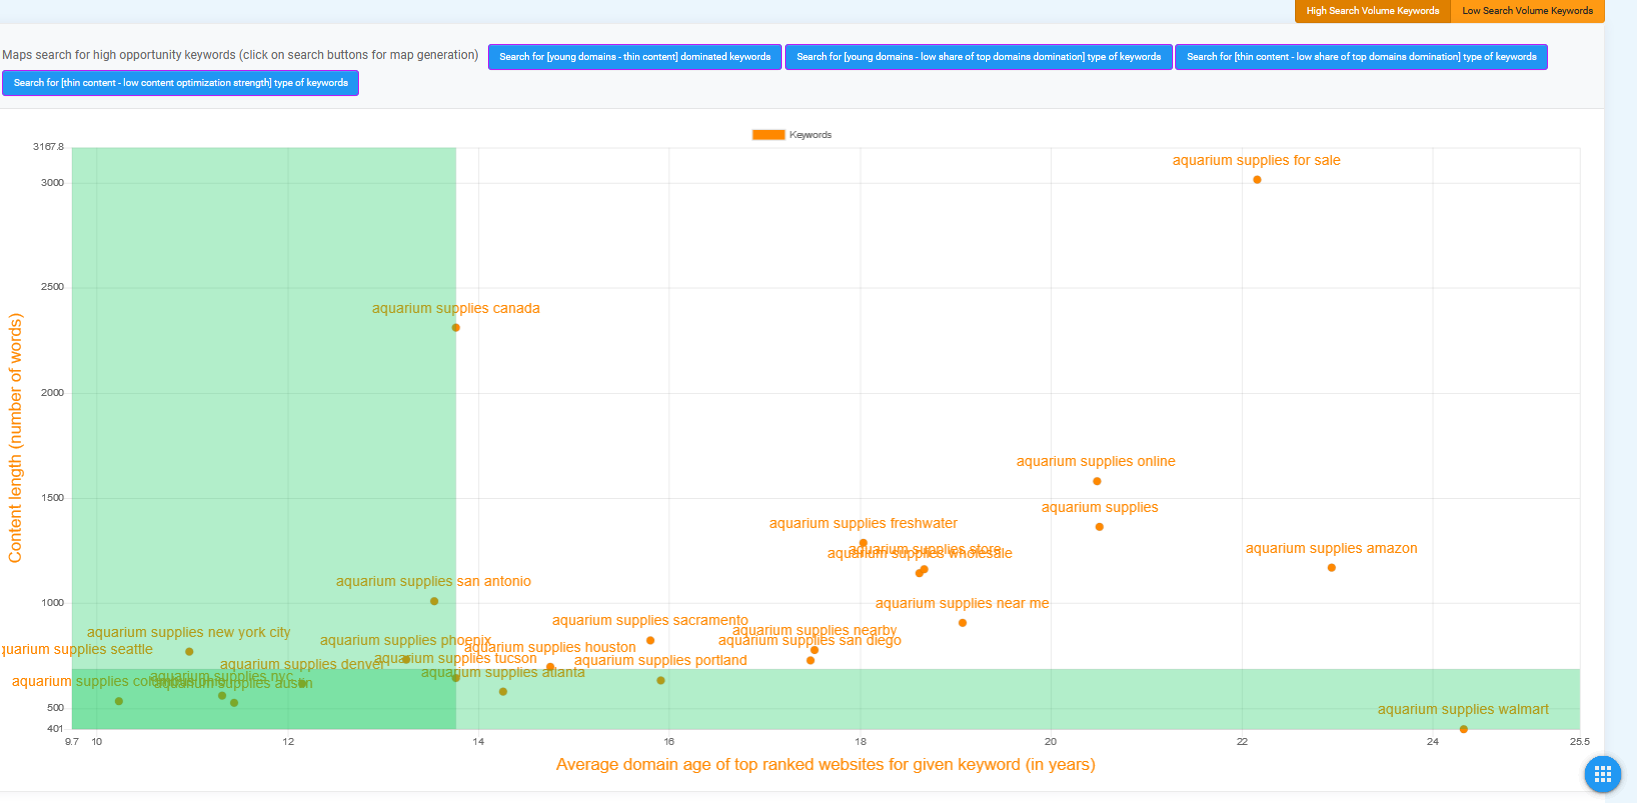
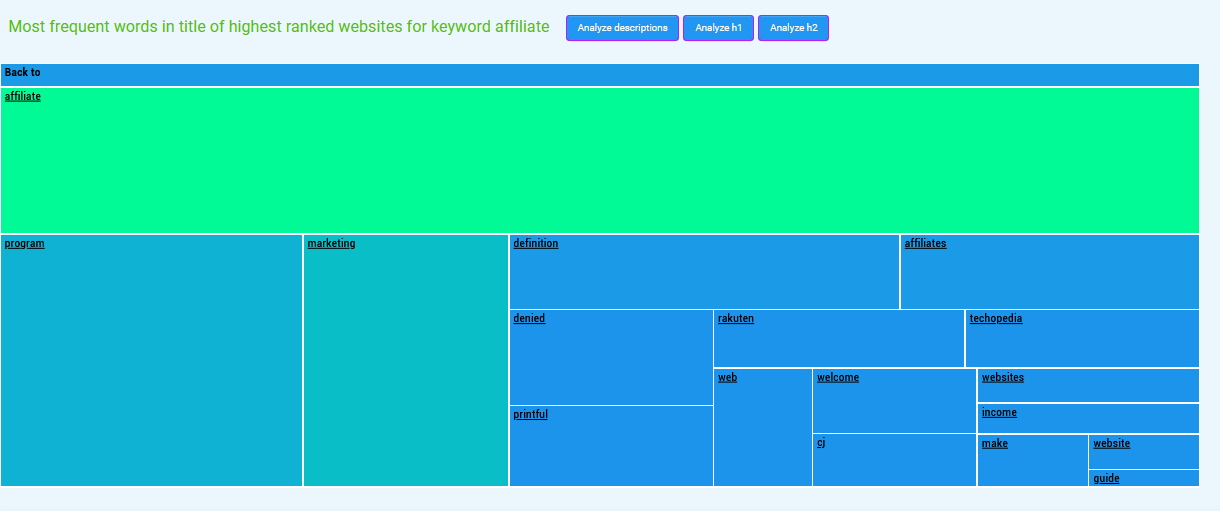
Here are a couple of images from our UnicornSEO platform that show the potential for data visualizations in content marketing:

Geo location of photos using deep learning

Computer vision is part of AI consulting tasks that often involve classification problems where one tries to train a deep learning neural net to classify a given image in one of discrete classes.

Typical examples are for example classifying images of animals, food, etc.

Classical problem from this set was classifying images as either cat or dog, see e.g. https://www.kaggle.com/c/dogs-vs-cats

Transfer learning

In cases like this one often uses the benefits of transfer learning. This means that one significantly short the time of development to train the NN for a particular CV problem by starting with the pre-trained neural net that was trained on some other computer vision problem.

It is common to use pre-trained models from well know and researched problems. Examples of pre-trained computer vision models are VGG  or Inception model.

Geo location from photos

Recently, as part of computer vision consulting, I came across a quite unique problem for computer vision, which involves a very interesting classification from images, where the results is a set of location coordinates, latitude and longitude.

In other words, given an image, the deep learning net tries to determine the physical location where the image was taken, giving a pair of number for latitude and longitude.

There are various researchers that took up this challenge. Several years ago, researchers with Google were some of the first with their PlaNet solution:

https://arxiv.org/abs/1602.05314

On first sight, the problem looks very difficult. One can easily find a picture where it is hard to detect the location. However, many images contain a lot of information due to presence of landmarks, typical vegetation, weather, architectural features and similar.

The approach taken by the PlaNet solution and another solution that we will describe shortly is to partition the surface of the earth in thousands of cells and then use a big set of geotagged images for classification. Example of huge dataset containing a large number of geotagged images is e.g. Flickr.

Another interesting approach is the one taken by the team from Leibniz Information Centre for Science and Technology (TIB), Hannover and 2 L3S Research Center, Leibniz Universitaet Hannover in Germany.

Their approach is similar to PlaNet – they divide the whole earth in cells but they also have a special decision layer which takes into account the scene content – whether it is indoor, natural or an urban setting.

I implemented their library https://github.com/TIBHannover/GeoEstimation  and can confirm it works with surprisingly good results.

The team has also put out an online version of their model and you can check it out here:

https://tibhannover.github.io/GeoEstimation/

If I send this image to the photo geo location tool:

The deep learning tool correctly puts the image in the mediterranean region (its correct location is Ibiza, Spain).